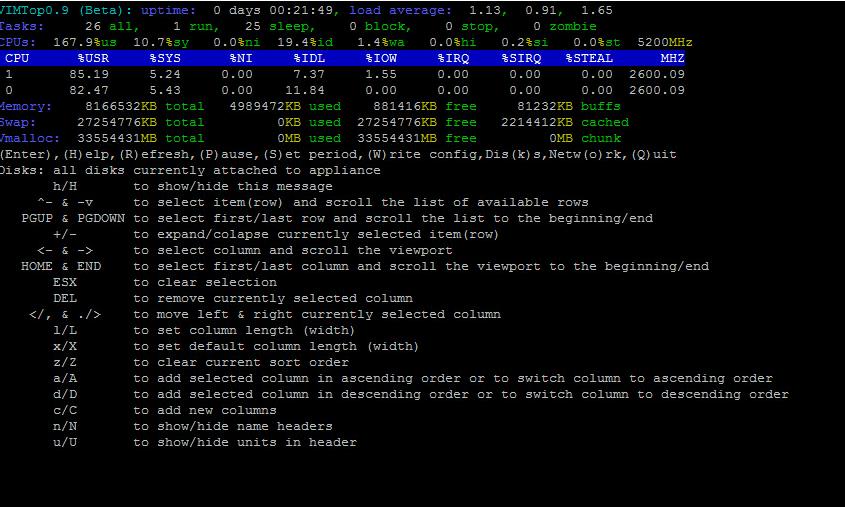
vimtop is one of the cool tool to monitor vCenter server appliance 6.5 performance information and statistics. vimtop is similar to esxtop which is available with ESXi. vimtop is the tool which helps you to troubleshoot performance issues or bottlenecks in the vCenter Server appliance. As a VMware Administrator, I am sure you will be very familiar with working with esxtop. vimtop is almost similar tool as esxtop. vimtop helps you to monitor the performance of vCenter server appliance and its services in real time. It will be really handful when you want to troubleshoot vCSA 6.5 performance issues.
Monitor vCenter Server Appliance 6.5 performance using vimtop
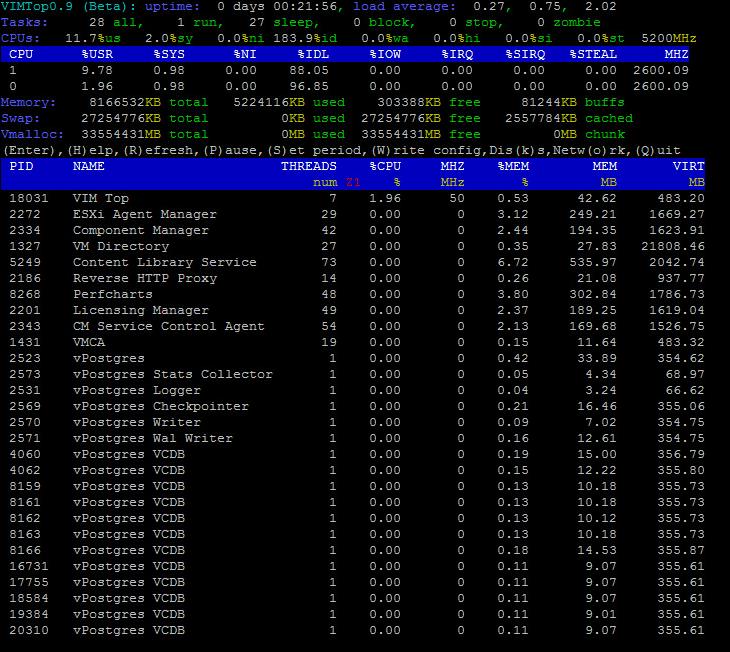
To launch the vimtop, you will need to SSH to a VCSA and type “vimtop” in either the appliance shell or in bash shell. When vimtop is launched, It displays the memory and CPU usage information along with the process or service name running on the VCSA along with its respective memory and CPU usage percentage. vimtop has good color representation as compared to esxtop which have better readability.
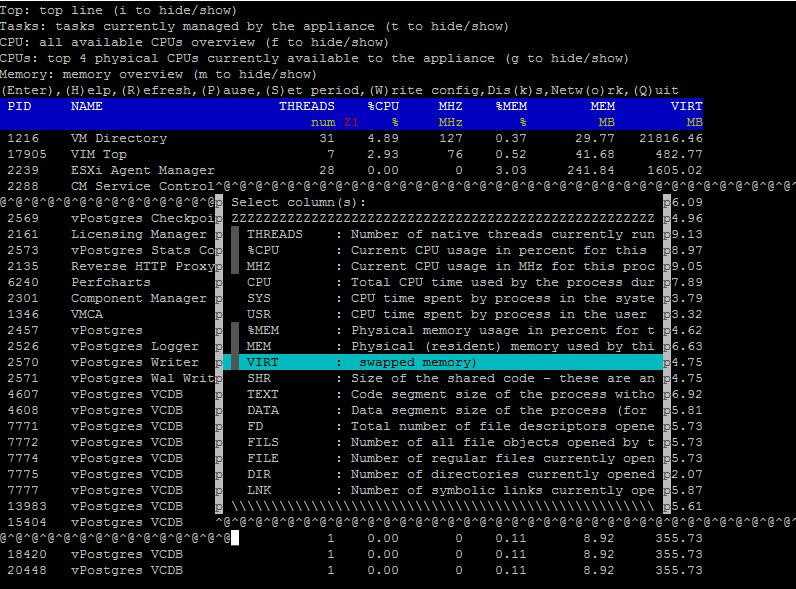
For each of the views, you can also add and remove different columns similar to esxtop using the “c” character. You can then select or de-select columns by using the spacebar for the metrics you wish to be displayed in the current view.
Click on “o” to switch to Network performance view of vCenter Server appliance. It displays as similar to esxtop such as RXRATE, TXRATE, dropped ,errors in the VCSA network stats.
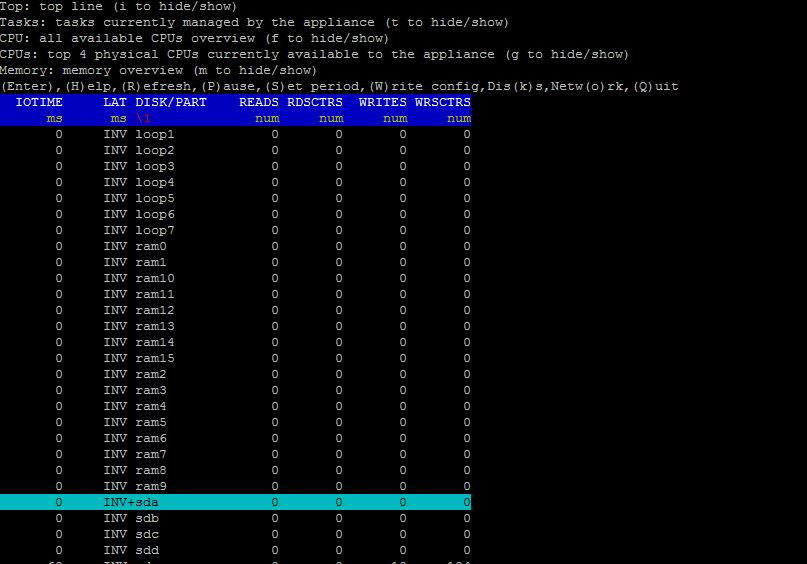
Enter “K” to display the disk performance view of vCenter appliance 6.5. This view help to monitor vCenter server 6.5 performance of disks.
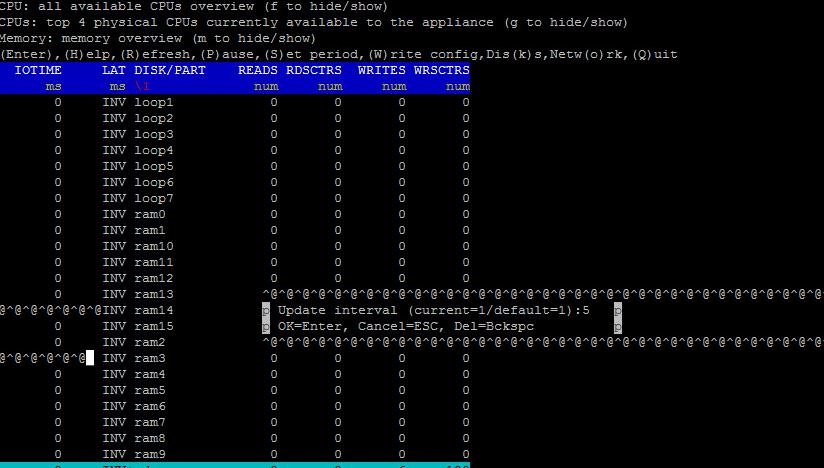
Press “S” to set the refresh interval for vimtop.
Below are the some of the helpful keyboard commands to work with vimtop to monitor vCenter server appliance 6.5 performance.
For more information on vimtop, William Lam has written excellent article about vimtop. I hope this is informative for you. Thanks for Reading !!. Be social and share it in social media, if you feel worth sharing it.


