ESXTOP – My favorite tool which really helps me in all the time during vSphere performance troubleshooting. Esxtop is a command-line tool that gives administrators real-time information about resource usage in a vSphere environment. It saves me quickly with the real time stats with exact information. It’s been more than 6 years i spend with vSphere administration. Still I am learning more everyday about ESXTOP. ESXTOP is available in two ways. Either through the ESXi Shell or through the vSphere Management Assistant(vMA) with the command RESXTOP. resxtop can be used remotely to view the resource utilization of ESXi hosts from VMA.
It is always a tough time when working with the ESXTOP because of large data displayed in the screen. ESXTOP height of the screen is limited in what it can display. You will really not be able to scroll down the screen of ESXTOP. It is always trouble for me when i am looking for specific objects which is hidden in the ESXTOP display because of the screen is limited and also you cannot scroll the screen down to your specific object like VM or LUN. I have faced mostly when i am trying to see the my storage device performance statistics. Unfortunately there is currently no command line option for esxtop to specify specific VMs/ LUN’s that need to be displayed. In the below screen, I am really not seeing the LUN’s which I really want to see the stats for and also I will not able to page down/Scroll down the ESXTOP screen to see all the LUNs.
Now, you can export the current list of worlds and import it again to limit the amount of VM’s or LUN’s shown.There is a option available with ESXTOP called “export-entity” and “import-entity”. Using this you can export the current list of worlds and import it again to limit the amount of VM’s or LUN’s shown. Let me Explain in detail.
ESXTOP -Export-Entity:
When I type Esxtop and Switch to “u” will display the all the storage LUNs which are connected to the ESXi. I am not able the see the stats of the LUN which i am really looking for. Let me use the Export-Entity option.
esxtop -export-entity <Location of the file>
Example:
esxtop -export-entity /tmp/Luns-limitedview
Open the File using Vi command and comment out with # whichever stats not needed.
Vi <location of the file>
Example:
vi /tmp/Luns-limitedview
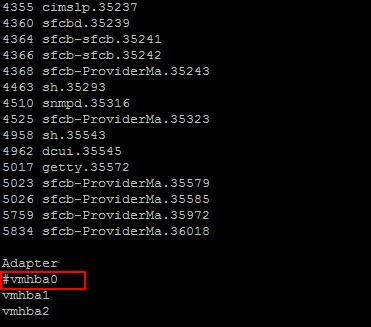
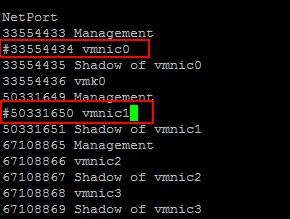
In My case, I don’t want to see the status of all the Disk adapters and all vmnic’s . So i have commented out both object “vmhba0” and “vmnic0 & vmnic1” with the symbol “#” infront of it and save the file and exit.
ESXTOP -Import-Entity
In the above step, we have commented out the unnecessary data with symbol “#” in front of the object. You need to execute the below command.
esxtop -import-entity <Location of the file>
Example:
esxtop -import-entity /tmp/Luns-limitedview
I want to see the stats for my storage adapter.When i swicth to disk adapter view in Esxtop by pressing “d”. It displays the stats only for the 2 adapter “vmhba1” and “vmhba2”. It doesn’t display the stats of “vmhba0” which i have commented out earlier.
Also When i see the network stats in esxtop by pressing “n”. It displays the stats only for “vmnic2 & vmnic3”. It is not displaying the stats for network adapter “vmnic0 & vmnic1” which i have commented out earlier.


