VMware vSAN is the distributed layer of software that runs natively as a part of the ESXi hypervisor. vSAN aggregates local or direct-attached storage disks of a host cluster and creates a single storage pool shared across all hosts of the cluster. We always need a tool to monitor and troubleshoot VMware vSAN performance especially disk performance. vSAN Observer is a monitoring and troubleshooting tool for Virtual SAN. We can also use ESXCLI VSAN commands to configure, manage and troubleshoot VMware vSAN.
The VSAN Observer is an RVC (Ruby vSphere Console) graphical user interface utility which displays VSAN related statistics from a VSAN Client perspective. The utility can be used to understand VSAN performance characteristics. The utility is intended to provide deeper insights of VSAN performance characteristics and analytics.
vSAN Observer helps us to monitor the performance statistics for a vSAN Cluster through a web browser and also it captures the statistics for customer use or for VMware. vSAN Observer is a feature of the Ruby vSphere Console (RVC)
How to Use VMware vSAN Observer to view vSAN Performance Statistics
To Launch vSAN Observer, Log in to the Ruby vSphere Console (RVC) on your vCenter Server Appliance through SSH and run the below command and enter the user password if prompted.
rvc ssousername@hostname

Example:

rvc administrator@vSphere.local@localhost
Run the CD command to navigate to your vCenter Server directory.
cd localhost
Navigate to the data center for your vSAN environment
cd datacenter Name
example:
cd BLR-DC
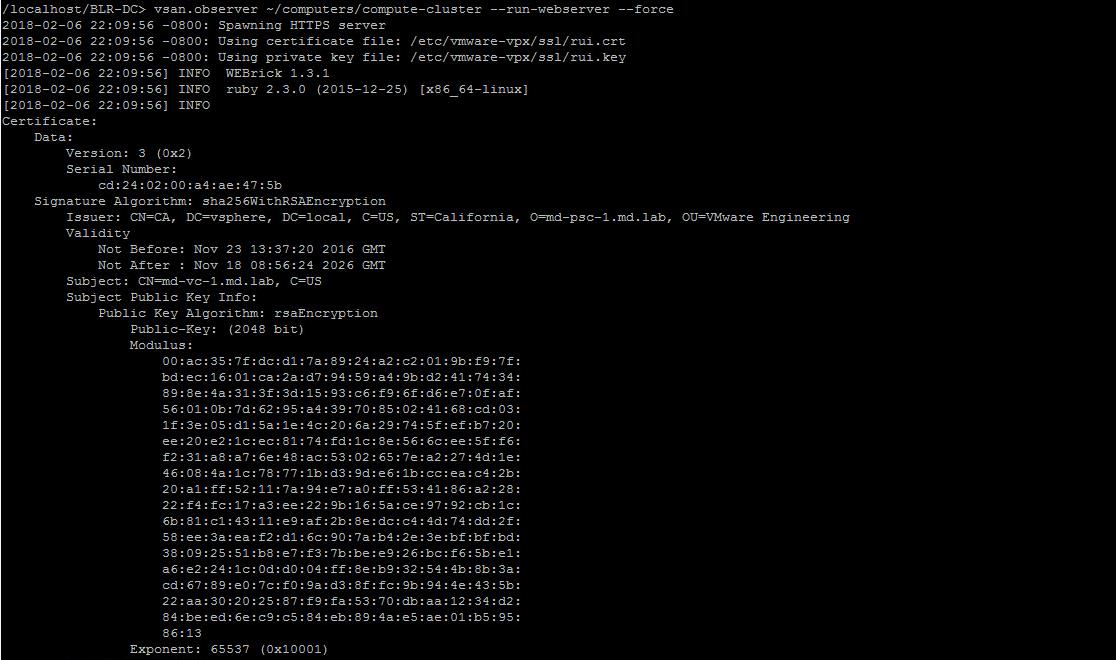
Run the below vsan.observer command to enable live monitoring for a cluster “compute-cluster”. You can replace the command with your cluster name
vsan.observer ~/computers/cluster-name --run-webserver --force

example:

vsan.observer ~/computers/compute-cluster --run-webserver --force
The above vsan.observer command starts running the live performance statics of the vSAN cluster.
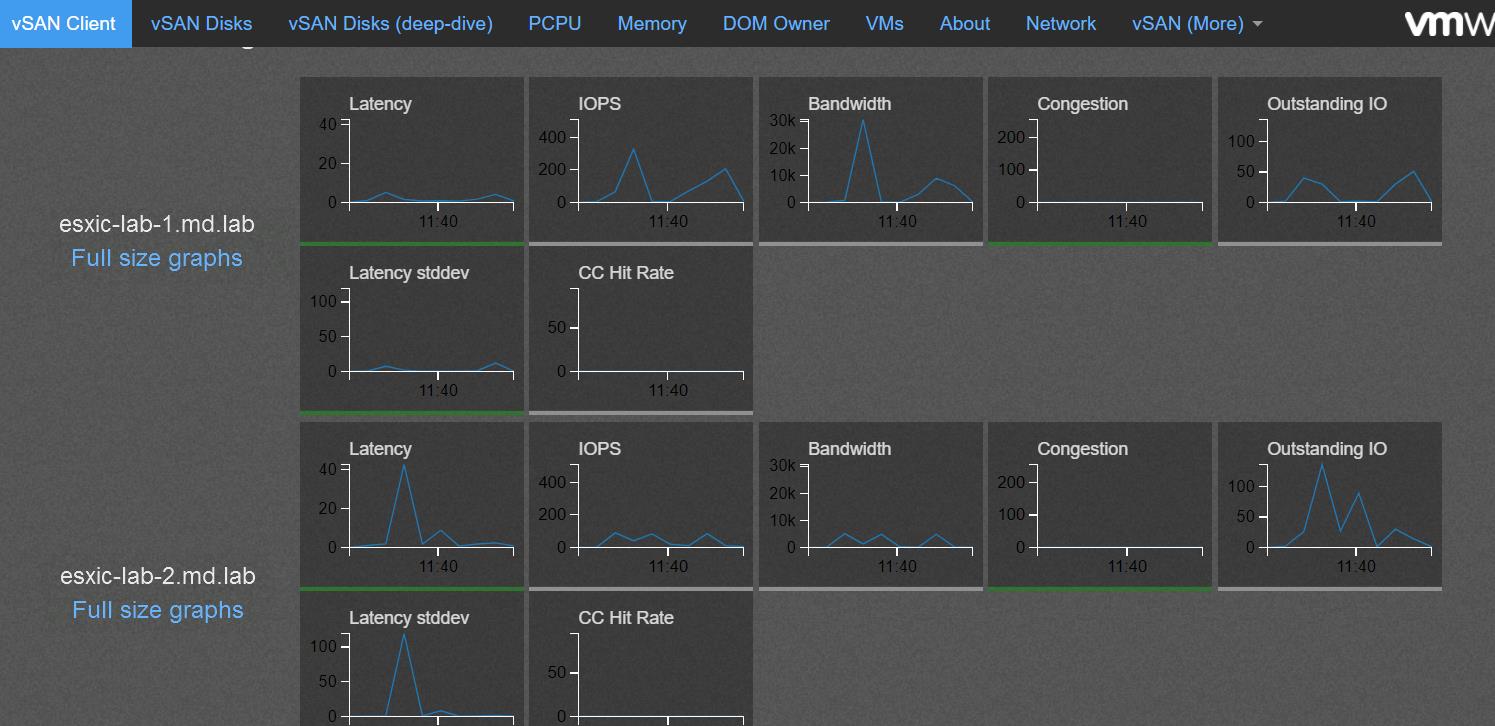
To view the live statistics in a web browser, point the browser URL to your vCenter Server hostname / IP Address with the port number specified in the output from the vSAN observer command. In my case, it is Port 8010
https://<name or IP of vCenter Server appliance>:8010
Login with SSO user account.
The VSAN Observer’s user interface displays performance information of the following items:
- Statistics of the physical disk layer
- Deep dive physical disks group details
- CPU Usage Statistics
- Consumption of VSAN memory pools
- Physical and In-memory object distribution across VSAN clusters
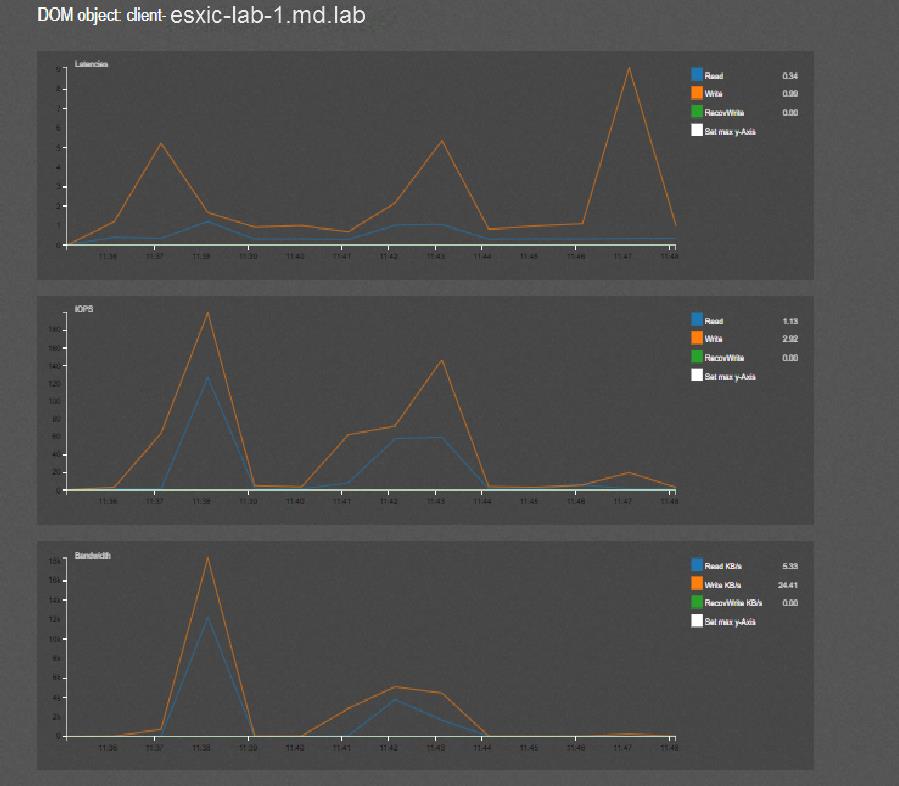
You can click on “Full-Size Graphs” to see the full-size performance graphs of the particular ESXi host in vSAN Cluster. It provides more information about the performance statistics.
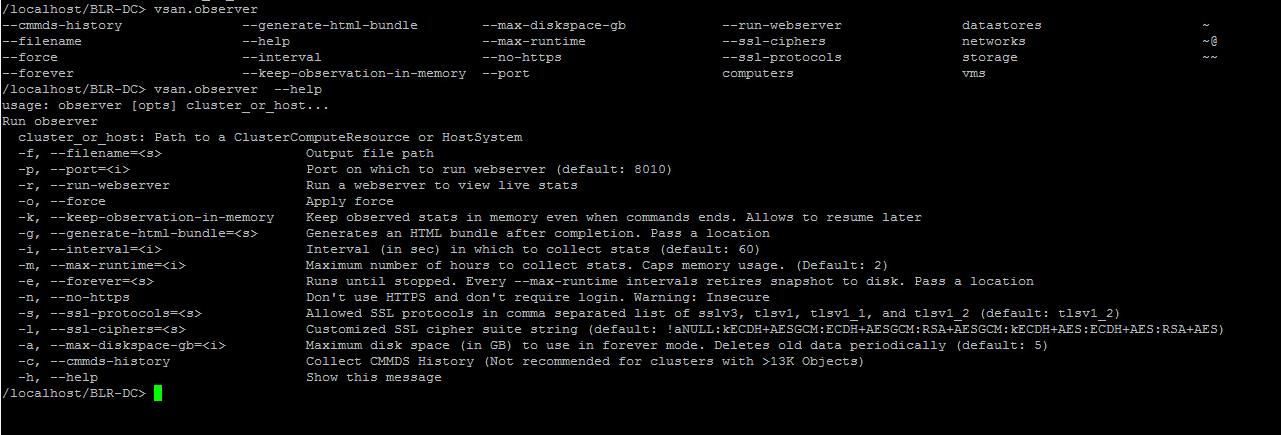
You can run help command to get help with vSAN Observer command:
vsan.observer –help
I hope you are now aware of how to use vSAN Observer to view the live performance statistics of vSAN hosts and cluster. Thanks for reading!!!. Be social and share it with social media, if you feel worth sharing it.


